
Fundratios is the charity fundraising benchmarking project which we operate in conjunction with the Institute of Fundraising.
Fundratios 2006 - Summary Report
1. Introduction and Overview
Fundratios is designed to help all charities, both large and small, to fundraise more effectively by producing a comprehensive analysis of all aspects of fundraising. Thirty-seven charities participated in the study. This document sets out to summarise the key findings of the study, in order for the results to be incorporated more effectively in fundraising activity.
The proportion of total income derived from voluntary income was 2% down on the previous year’s study, at 55%, while fees for services and grants constituted the second largest source of income at 34%.
It was noted that smaller charities rely more heavily on grants, particularly very small charities. Income from legacies produced a similar pattern to the previous year, forming 25% of all income for larger charities compared to only 11% for those smaller in size. However, while legacy income rose by 4.6% compared to the previous year, overall growth in voluntary income decreased from 11.7% to 4.2%.
Areas that showed an increase in income were:
|
|
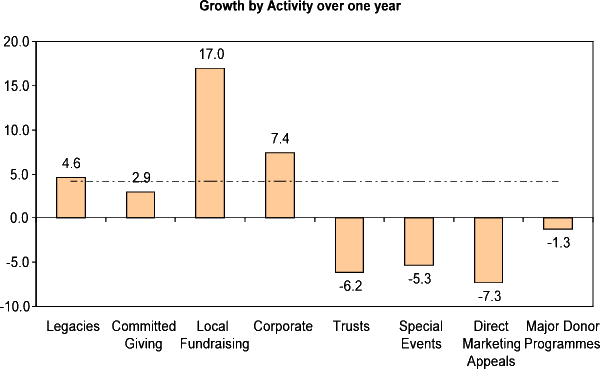
Local Fundraising (up 17%)
|
|
|
Corporate Income (up 7.4%)
|
|
|
Committed giving (up 2.9%)
|
2. Sources of Voluntary Income

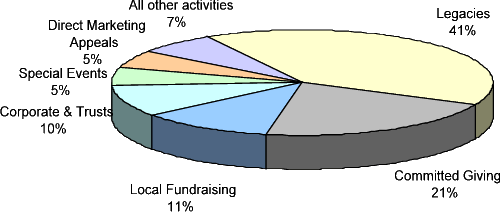
Chart 1 shows a simplified analysis of the main sources of voluntary income. As has been the case for many years, legacies provided around 40% of total voluntary income; 60% is actively fundraised, which means that the group of charities rely on active fundraising for approximately one third of their total income.
Committed giving has grown in the past seven years to become the second largest source at 21% of voluntary income followed by local fundraising (11%). Corporate, trusts, events and direct marketing appeals provide the bulk of the remainder with a variety of other activities, major donor programmes, emergency appeals, unsolicited donations etc., completing the picture.
3. Revenue Growth
As noted above this year, growth was the lowest in seven years although still satisfactory in relation to that of the economy.
A slowdown in the growth of committed giving was central to the easing of the growth rate. After a number of years during which it has consistently enjoyed double digit growth, committed giving income rose by just 2.9%.
Local fundraising (up 17.0%) was the main growth area, corporate rose 7.4% and legacies were up 4.6%. Other activities saw a drop in income.

4. Fundraising Expenditure
The group spent 9.7% more on fundraising this year, but the pattern of investment by activity shows a break with the recent mould.
Investment in committed giving was cut (by 5.4%) this year for only the second time in seven years. The only previous cut in recent years was a modest 3.6% reduction in 2002 but that represented a slight scaling back after a 67% increase in 2001. Nonetheless committed giving still accounted for over 30% of expenditure.
Next came local fundraising which took 21% of the budget, attracting 11.5% more funds. This represents a marked change to the trend of recent years which has seen a steady decrease in funding for local fundraising. The switch would appear to be justified by the 17% increase in income.
Direct marketing appeals (14.6% of the budget) attracted 32% more funding - although income fell. Major donor programmes attracted substantially more funds reflecting the continued development of this activity.
The main areas of expenditure are summarised in the table below:
Analysis of Fundraising Expenditure
|
Activity |
Share of Budget |
% increase (decrease) |
|
Committed giving |
30.9 |
(5.4) |
|
Local fundraising |
21.0 |
11.5 |
|
Direct marketing appeals |
14.6 |
31.8 |
|
Special events |
10.3 |
2.8 |
|
Corporate |
7.3 |
3.9 |
|
Legacies |
4.2 |
10.2 |
|
Major donor programmes |
3.9 |
202.6 |
|
Competitions/lotteries |
3.7 |
26.0 |
|
Trusts |
2.3 |
(0.5) |
|
All other |
1.9 |
na |
|
|
|
|
5. Return on Investment
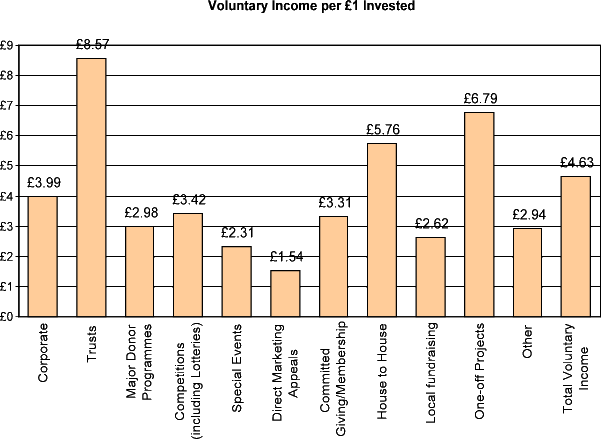
Paradoxically, committed giving which saw its lowest growth in recent years made a better return on investment as the cut in investment of 5.4% did not cause an immediate fall in income, merely a slower rate of growth (plus 2.9%) so return on investment rose from £2.85 to £3.31 per £1 invested.
The median returns from the majority of activities are shown on the chart below. The exceptions are legacies, with a return of £32.17 and emergency appeals which likewise have a very high return (£33.50).

6. Highlights by Activity
Corporate
Corporate income provided 6.4% of all voluntary income, and accounted for 7.3% of fundraising costs. Corporate income averaged £933,000 per charity for the group as a whole. Of this 52% was due to donations, with a median value of £329,000 per charity and a typical donation of £5,323.
There was a 30% rise in income from corporate sponsorship. Approximately half of the charities analysed were a corporate ‘Charity of the Year’ which provided an average income of £58,000.
Trusts
Trusts accounted for 3.5% of voluntary income in 2005/2006 and 2.3% of fundraising costs. Following a small decrease the previous year, income from trusts fell by 6.2%, but cost-effectiveness remained good at £8.57 per £1 invested.
Continuing the trend of previous years, smaller charities tended to win bigger grants, with the median grant for smaller charities reaching £5,006 compared to the median for larger charities at £3,607.
Income per £1,000 of fundraisers’ salary averaged £9,804, a further increase on last year.
Major Donor Programmes
Major Donor Programmes comprise 1.9% of total voluntary income, yet account for 3.9% of fundraising costs. The programmes gave a satisfactory return of £2.98 per £1 invested, similar to last year. However, following a previous period of intense growth, income fell slightly, down 1.3%.
The size of gifts remained high in 2005/2006, with 70.3% of gifts over £10,000.
Legacies
Legacies formed the largest proportion of voluntary income at 40.4% of the total; they account for only 4.2% of fundraising costs. Although growth was lower than the 6.5% of the previous year, this area of the sector did continue to show growth of 4.6% which was important in offsetting losses elsewhere.
Residuary legacies of less than £250,000 provided 72% of all legacy income, which was unchanged from the previous year. The typical value of these legacies was £28,700.
Pecuniary legacies averaged £3,000. Legacy promotion attracted 10% more investment over the year; the cost per pledge was similar to the previous year, typically £571. New legacy notifications were up 7.5% on levels five years ago.
Gaming, Lotteries and Competitions
These activities accounted for 1.6% of voluntary income, and 3.7% of fundraising costs. Of the charities analysed, approximately half conducted lotteries. Income per £1 invested was £3.42. The fortunes of charities promoting lotteries varies considerably. Some charities doubled expenditure and suffered falls in income; others substantially cut expenditure and saw a rise in income.
Special Events
Earning 5.4% of voluntary income, special events used 10.3% of fundraising budgets. Investment in events increased by 2.8% and income was down 5.3%. For every £1 invested, income reached £2.31. Mass participation events provided 56% of events-related income and activity events provided 27%, a steadily increasing proportion.
Profitability of activity events averaged £22,000 per event, while mass participation events averaged £122,600. Gala events typically made £73,500 per event.
Direct Marketing Appeals
Direct Marketing Appeals provide 5.4% of voluntary income, but take 14.6% of fundraising costs. Following a good increase the previous year, income decreased by 7.3%, while expenditure increased by 32% – income per £1 invested was only £1.54.
Within the total Direct Mail provided 90% of income and commanded 80% of the budget. Warm direct mail accounted for 78.6% of direct marketing but it did not receive as good a response as the previous year, falling from 13.9 to 8.9%. Income per £1 invested for warm direct mail was £3.85.
The cold mailing response rate was, as would be expected, much lower at 1.5%, providing a typical return of £0.42.
List exchange and ‘other media’ did not cover costs, resulting in returns of £0.98 and £0.67 respectively.
Committed Giving and Membership
Committed Giving and Membership accounted for 21.0% of voluntary income and 30.9% of fundraising costs in 2005/2006. Following several years of growth, charities cut their investment in this area by 5.4%, yet income grew by 2.9% (in the previous year costs rose by 25% and income grew by 18.9%). Income per £1 invested grew from £2.85 in the previous year to £3.31 in 2005/2006.
This method of fundraising takes a higher proportion of the fundraising budget than any other. Although retained givers provide 86% of income, the majority of the costs are in acquiring new givers.
Face-to-face marketing accounted for 25% of new givers, and door-to-door provided the second largest source of new givers at 17.3%.
Larger charities with more mature committed giving programmes used a much more varied means of recruitment. In contrast, smaller charities relied on face-to-face contact for 47% of their recruits and door-to-door for 31% (in larger charities those activities accounted for 18 and 13% respectively).
Apart from warm direct mail which cost an average of £29.24 per new donor, acquisition costs were well in excess of the annual gift, with average recruitment costs amounting to 127.5% of the average new annual gift.
House-to-House Collections
House-to-house collections totalled 0.6% of voluntary income and 0.5% of fundraising costs. Only 8 charities provided detailed data on this method. All but 2 of these reported a lower income than previous years, but the collections continued to produce a satisfactory return of £5.76 per £1 invested.
Local Fundraising
Local Fundraising was one of the few areas to enjoy good growth (up 17.0%), accounting for 11.3% of voluntary income and 21.0% of fundraising costs. After legacies and committed giving, it was the third largest source of voluntary income. Activities such as lotteries, special events and house-to-house collections also make use of local fundraisers. In such cases the total local effort equals approximately 13% of the voluntary income. On average, local fundraising made a return of £2.62.
Emergency Appeals and One-Off Projects
Emergency appeals and one-off projects were not a significant source of income for the charities in the 2005/2006 study.
Donations and Gift Aid
Donations refer to those donations that could not be directly attributed to other fundraising activities. These accounted for 1.6% of the year’s voluntary income, with the amount received 4% down on the previous year’s total.
There continue to be significant variations in the extent to which charities take advantage of gift aid. Committed giving had the highest proportion of gift-aided contributions at 66%, but this was still down on the previous year. Most major donors used gift aid in the previous year, but again this was down in 2005/2006. Emergency appeals received the least gift aid.
Approximately 50% of Direct Marketing income was gift-aided, similar to prior years.
Trading
There was little change in the profitability of shop trading, with a median return of £1.26 per £1 invested. There was further modest growth in sales at 4.2% and costs rose slightly, resulting in the median margin falling from 21.3 to 20.6%.
Income from mail order trading fell by 5.8%, but margins were maintained. There was a return of £1.49 per £1 invested. The typical response rate to the main catalogue was 4.5%, which was a slight decrease on the previous year. The average order size was £29.66.
If your charity is interested in taking part in Fundratios:
We will be marketing Fundratios 2007 shortly. For further information on the project, please click here.
